| PARAMCD | USUBJID | RANDNO | TRTSEQP | APERIOD | TRTP | Tmax | Cmax |
|---|---|---|---|---|---|---|---|
| TTRL | YDTTL230204-01-S002 | K001 | R-T | 1 | R | 5.000000 | 3830 |
| TTRL | YDTTL230204-01-S002 | K001 | R-T | 2 | T | 5.000000 | 3670 |
| TTRL | YDTTL230204-01-S003 | K002 | R-T | 1 | R | 5.000000 | 4260 |
| TTRL | YDTTL230204-01-S003 | K002 | R-T | 2 | T | 5.016667 | 5340 |
| TTRL | YDTTL230204-01-S005 | K003 | T-R | 1 | T | 2.500000 | 1690 |
5 Tmax非参检验
5.1 Wilcoxon Rank Sum Test
测试数据使用2023017 pp
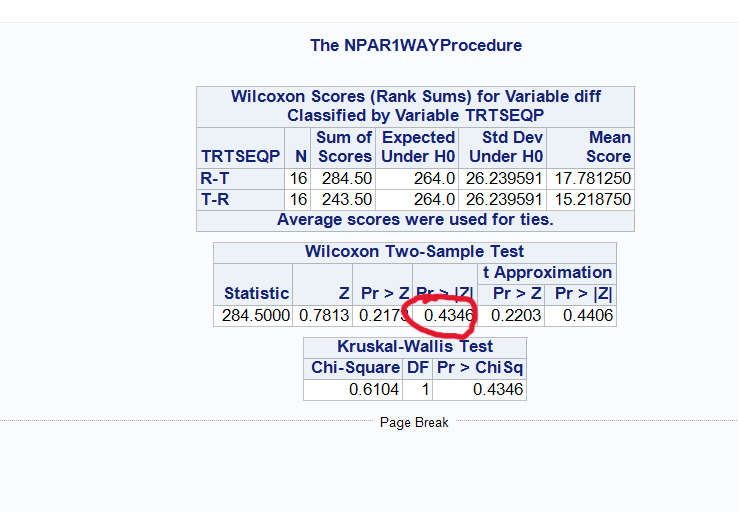
R结果中的的W统计量和sas与winnonlin的统计量都不一样,r结果中统计量其实是U statistic,\(U = W-\frac{n_1(n_1+1)}{2}\),其中W为wilcoxon 统计量,\(n_1\)为某一组样本量。假设检验来自 Koch (1972)
5.1.1 Hypothesis 1: no sequence effect (or drug residual effect);
tmax_sum_wilcoxon <- df_pp%>%group_by(RANDNO, TRTSEQP)%>%
  summarise(sum_tmax = sum(Tmax))%>%
  wilcox.test(sum_tmax~TRTSEQP, data = .,
              exact = F, conf.int = T, correct = F)
tmax_sum_wilcoxon
    Wilcoxon rank sum test

data:  sum_tmax by TRTSEQP
W = 177, p-value = 0.06368
alternative hypothesis: true location shift is not equal to 0
95 percent confidence interval:
 -2.199322e-06  3.000002e+00
sample estimates:
difference in location
1.000007 tmax_sum_wilcoxon%>%pluck("statistic")+16*17/2 W
313 5.1.2 Hypothesis 2: no treatment effect given no sequence effect;
5.1.2.1 R结果
tmax_diff_wilcoxon <- df_pp%>%pivot_wider(id_cols = c(RANDNO, TRTSEQP),
                           names_from = APERIOD,
                           values_from = Tmax)%>%
  mutate(dij = (`1`-`2`))%>%
  wilcox.test(dij~TRTSEQP, data = ., exact = F, corr=F)
tmax_diff_wilcoxon
    Wilcoxon rank sum test

data:  dij by TRTSEQP
W = 148.5, p-value = 0.4346
alternative hypothesis: true location shift is not equal to 0tmax_diff_wilcoxon%>%pluck("statistic")+16*17/2 W
284.5 5.1.3 Winnonlin 结果:
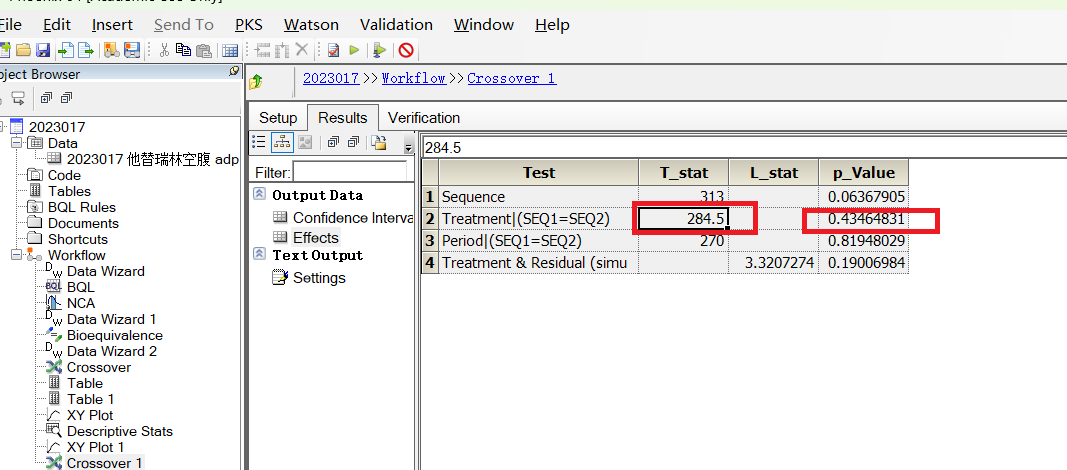
5.1.4 sas 结果
```{sas}
proc import datafile="D:/SASPrj/SASTraining/zhushuai/QC_pp.csv"
    out=work.input_pp
    dbms=csv
    replace;
    guessingrows=max;
run;

data pp_test;
set input_pp;
keep randno tmax TRTSEQP APERIOD;
run;

proc transpose data=pp_test out=pp_wide prefix=value_;
    by randno TRTSEQP;
    id APERIOD;
    var tmax;
run;

data pp_wide_sum_diff;
set pp_wide;
    sum = value_1+value_2;
    diff = value_1-value_2;
run;

proc npar1way wilcoxon correct=no data=pp_wide_sum_diff;
class TRTSEQP;
var diff;
run;
```
5.1.5 示例2
5.1.5.1 R
使用2025045 adpp 再次验证
tmax_sum_wilcoxon <- df_045%>%filter(PARAMCD=="TMAX")%>%
  group_by(TRTSEQP, USUBJID)%>%
  summarise(tmax_sum = sum(AVAL))%>%
  wilcox.test(tmax_sum~TRTSEQP, data = .,
              exact = F, conf.int = T, correct = F)
tmax_sum_wilcoxon
    Wilcoxon rank sum test

data:  tmax_sum by TRTSEQP
W = 1032.5, p-value = 0.8416
alternative hypothesis: true location shift is not equal to 0
95 percent confidence interval:
 -1.999985  1.016673
sample estimates:
difference in location
         -3.431204e-05
tmax_diff_wilcoxon <- df_045%>%filter(PARAMCD=="TMAX")%>%
pivot_wider(id_cols = c(USUBJID, TRTSEQP),
names_from = APERIOD,
values_from = AVAL)%>%
mutate(dij = (`1`-`2`))%>%
wilcox.test(dij~TRTSEQP, data = .,
exact = F, conf.int = T, corr=F)
tmax_diff_wilcoxon
    Wilcoxon rank sum test

data:  dij by TRTSEQP
W = 635, p-value = 0.0008451
alternative hypothesis: true location shift is not equal to 0
95 percent confidence interval:
 -2.9833738 -0.9999728
sample estimates:
difference in location
             -1.999977
5.1.5.2 Winnonlin 结果
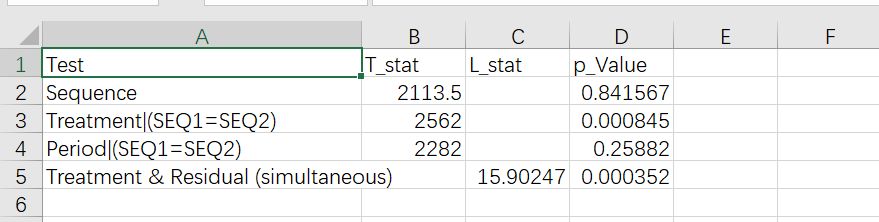
5.2 Signed Rank test
tmax_cross_diff <- df_045%>%filter(PARAMCD=="TMAX")%>%
  pivot_wider(id_cols = USUBJID, names_from = TRTP, values_from = AVAL)%>%
  mutate(cross_diff =T-R )%>%drop_na(cross_diff)%>%pull(cross_diff)

tmax_cross_diff_nozero <- tmax_cross_diff[tmax_cross_diff!=0]
sum(rank(abs(tmax_cross_diff_nozero))[tmax_cross_diff_nozero > 0])
[1] 1907Reference
Koch, Gary G. 1972. “The Use of None-Parametric Methods in the Statistical Analysis of the Two-Period Change-Over Design.” Biometrics 28 (2): 577–84. https://doi.org/10.2307/2556170.